Reflective display · color science · software
Experimental ICC method and results
Color management before the same Pimoroni renderer: how the experimental profiles changed pixel choices and measured color error.
An experimental profile improved the first color-grid results
My first experiment kept Pimoroni's renderer and added color management before it. Here, the experimental ICC profile described the color response of the rendering-and-display setup under its characterization conditions, so a color-management system could translate image colors for that fixed process. I used it to convert the source sRGB image into new RGB values intended for this display, then passed those values to the same Pimoroni renderer.
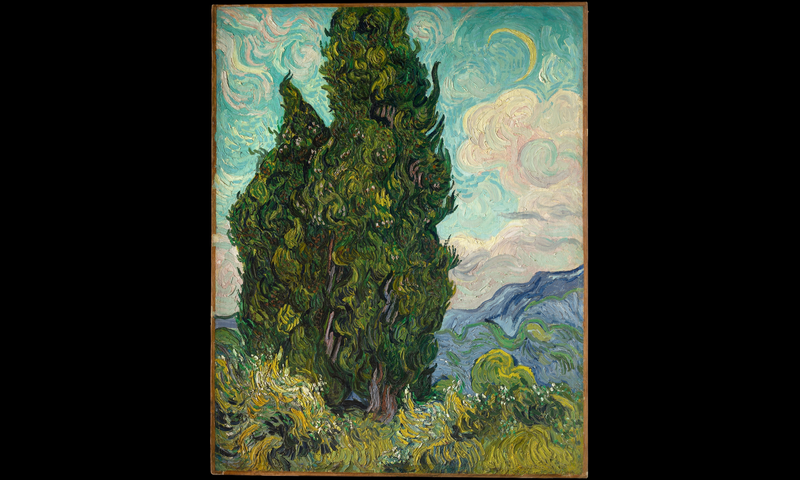
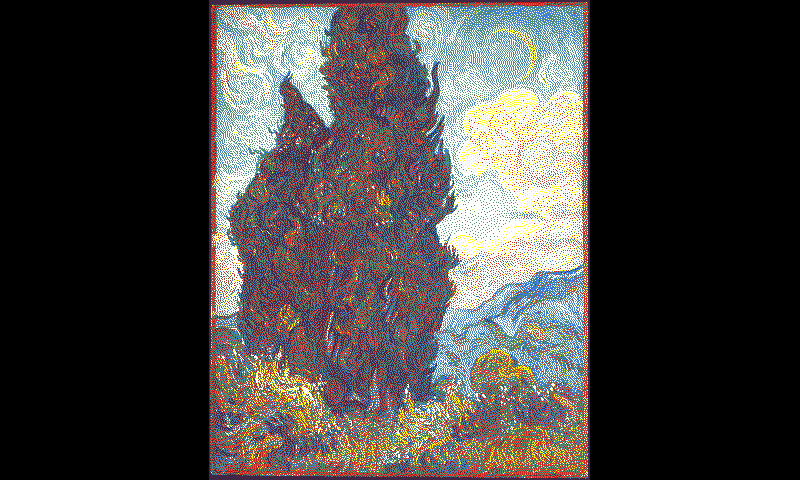
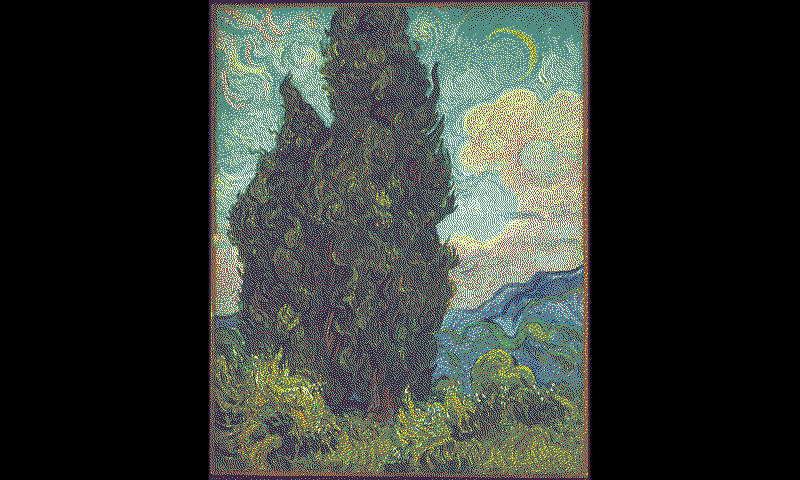
Vincent van Gogh, Cypresses, 1889. The Metropolitan Museum of Art, 49.30, Rogers Fund, 1949. Public domain. The generated maps use measured native-state colors, scaled so the measured display white appears as screen white. They do not simulate absolute brightness, contrast or spatial interactions. The 133-color comparison below supplies the optical measurement of the two routes.
I could also see the difference when displaying the images on the physical panel. That is a visual observation; the numerical comparison below comes from a separate color grid.
See the same comparison on The Bedroom
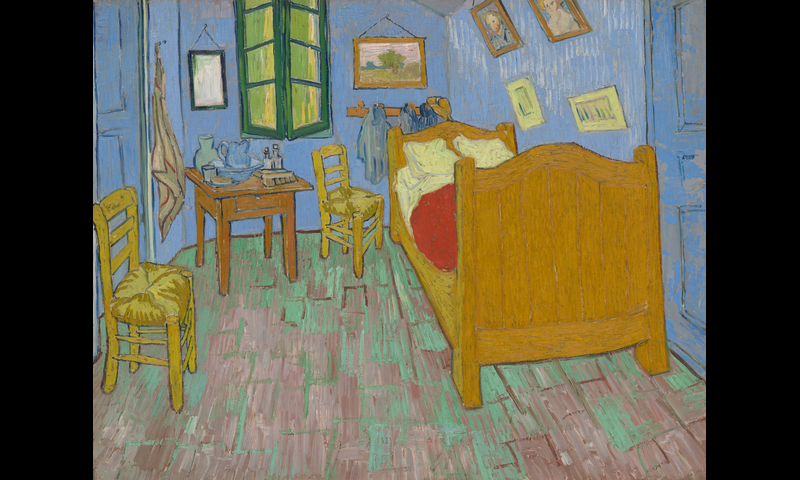
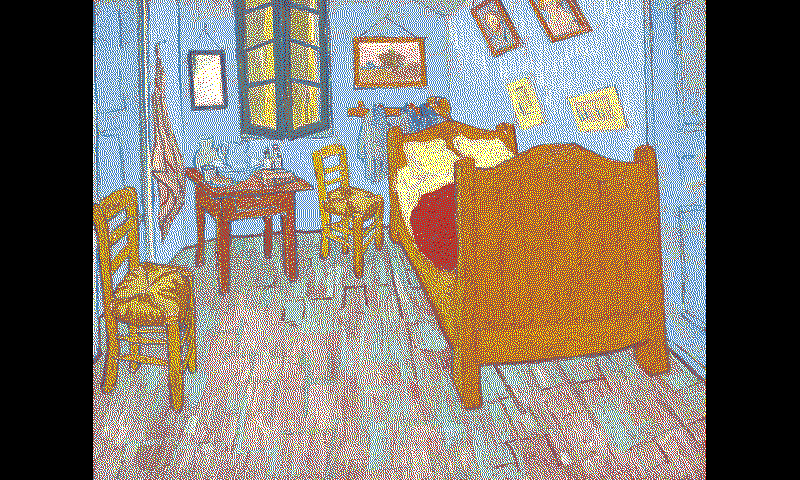
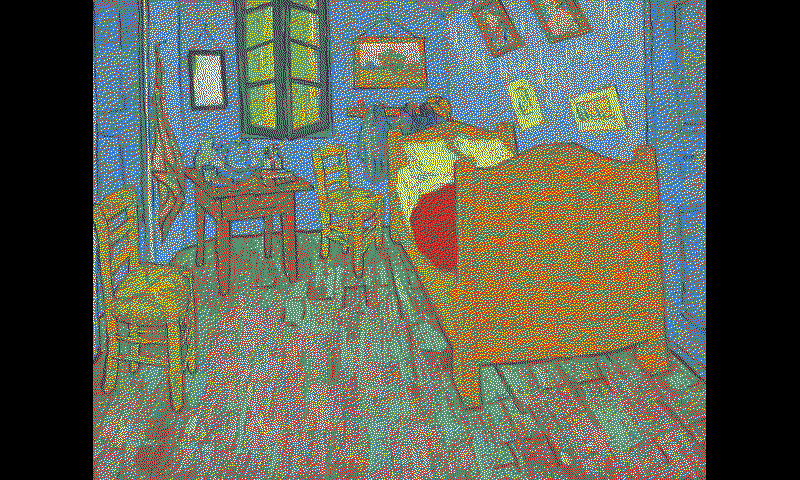
Vincent van Gogh, The Bedroom, 1889. The Art Institute of Chicago, 1926.417, Helen Birch Bartlett Memorial Collection. Public domain. The generated maps use the same measured native-state colors, scaled so display white appears as screen white.
Lower average error on a separate 133-color grid
The generated pixel maps show which native-state choices changed. A separate test measured 133 source colors to compare the routes numerically. Lower ΔE00 means closer to the requested color. Under that campaign's conditions, the dense ICC-managed route had a lower average color error than the stock route. This 133-color comparison did not evaluate the project renderer.
| Rendering route | Mean error | Largest error |
|---|---|---|
| Pimoroni renderer | 19.9922 | 42.1941 |
| Sparse ICC + Pimoroni renderer | 12.2568 | 26.4508 |
| Dense ICC + Pimoroni renderer | 11.2006 | 23.7069 |
The optical comparison used a separate 133-color grid rather than the paintings shown above. Errors used measured-media-relative D50 Lab against each requested target, averaging repeated errors per source and then the 133 source values equally. The dense route had the lower overall mean while individual colors varied. This development comparison applies to the tested renderer, display and measurement condition.
What the two experimental profile versions describe
“Sparse” and “dense” refer to the color grids used to construct the profiles, not the display's pixel density. The dense version used a modeled grid built from measured native states and an optical mixture model. The artwork route used relative-colorimetric conversion before the unchanged palette separation.
Adding the ICC conversion changed the pixels Pimoroni chose and reduced average error on the measured grid. To improve pixel selection further, I continued measuring the display's color response. Those measurements exposed an unexpected dependency: keeping the color proportions the same did not always keep the measured color the same.