Fernando Voltolini de Azambuja

Imaging and color measurement

Camera image quality, spectral measurement, and deterministic color models, measured in C++20 against archived captures and instrument data.

Skip to the implementation

Each investigation below states its question, its result, and the limitation that governs that result. The study pages add the method and the experiment that would resolve what is still open.

Some studies reanalyse retained camera or instrument measurements; others use controlled synthetic inputs to isolate an algorithm or equation. Each result identifies the inputs behind it and what the available records cannot establish.

Camera measurements

SFR/MTF across aperture and field

Across 299 accepted regions the D810 center peaked cleanly at f/5.6 and exceeded the strongest physical corner at three of its four mapped apertures. The D800 did not reproduce that trend and put its field maximum off-axis. Because focus, lens identity, alignment, and field orientation were not controlled across the sessions, the result supports separate field criteria for these captures rather than a camera-body or lens ranking.
Read the study

CFA flat-field response

Only 3 of 52 sphere frames had usable headroom. Across those frames, four corner blocks at equal distance from the center spread by 16.1–20.0% of their average. A field depending only on radius must give all four the same value, so the centered radial model is excluded for each accepted field. The archive cannot separate sphere, lens, alignment, and sensor contributions.

Read the study

ColorChecker extraction and CCM validation

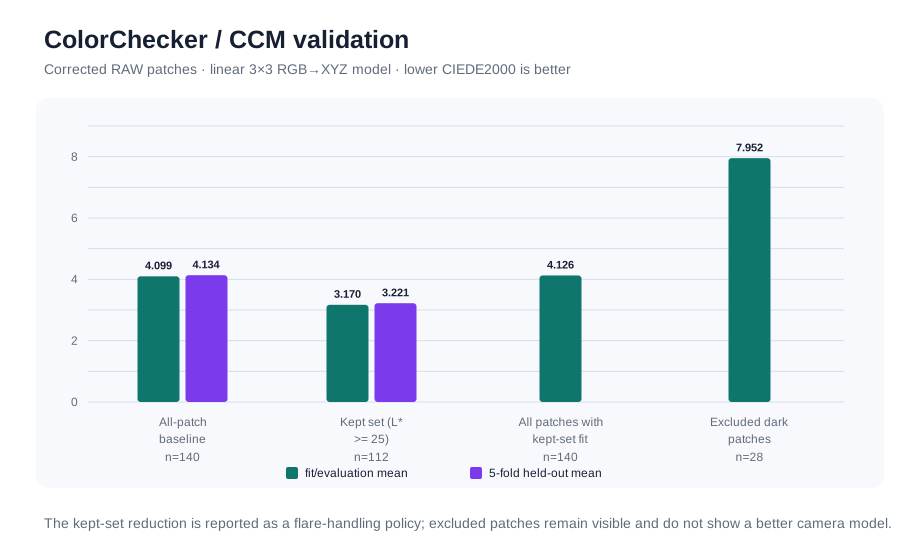
Held-out error was 4.134 mean CIEDE2000 against 4.099 training error, a gap of 0.035 that shows little patch-fold overfit. Restricting the fit to lighter patches produced a headline that looked 22% better while all-patch error remained 4.126 and excluded dark-patch error was 7.952 — the lower headline came from patch selection, not a better all-patch model.

Read the study

Spectral and instrument studies

Spectral sensitivity and camera color fidelity

Four cameras predicted their 140-patch chart captures to 9.5–13.8% RMS per channel. Across five measured sensitivity sets the SMI range on the 18 chromatic-patch set was 88.3 to 90.7, while mean CIEDE2000 under the same declared D55 calculation spanned 0.88 to 1.10. Closure tests the four paired sensitivity/capture paths; it is not a ranking uncertainty and does not validate the fifth camera’s cross-rig endpoint. The middle ordering also changes with analysis choices and is not presented as a firm ranking.

Read the study

Recovering spectroradiometer measurements

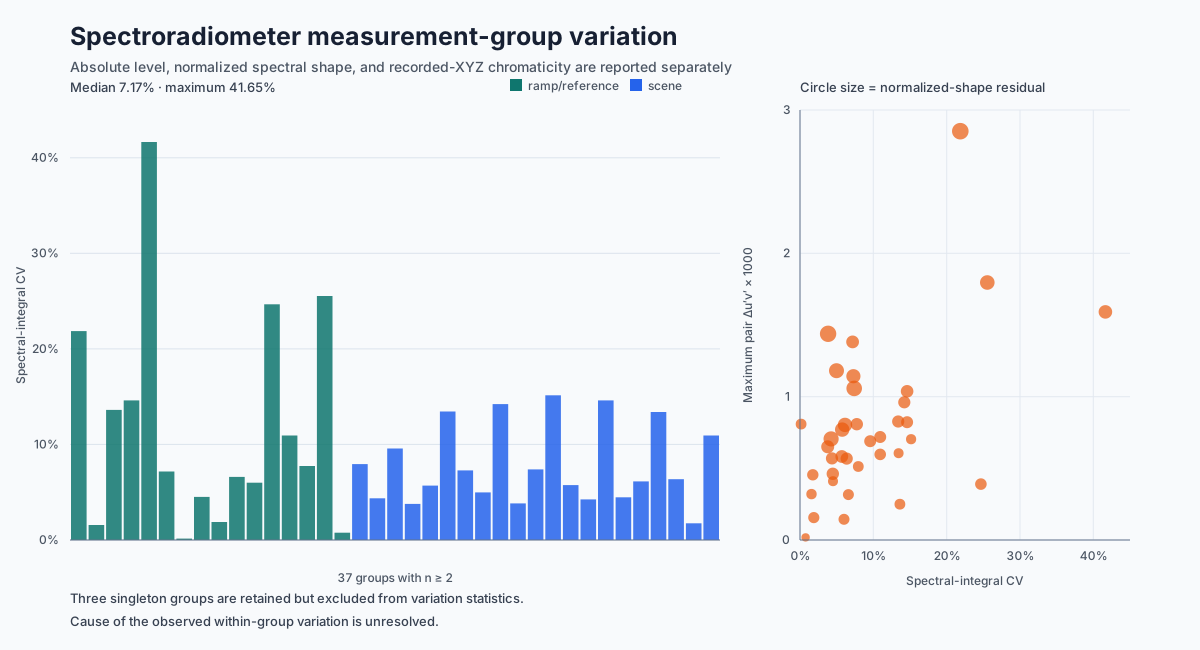
Content identity separated 89 distinct readings from 45 byte-identical aliases, and the retained grouping record organized the readings into 40 groups. Median within-group level variation was 7.17% and the worst reached 41.65% — but the level maximum occurred in a different group from the shape and chromaticity maxima, so no single stability number describes the archive.

Read the study

Spectral measurement cross-check

Two bands at 530 and 540 nm carry 75.9% of the squared residual, and dropping them takes the comparison from 4.327% to 2.276%. A fitted wavelength offset lowers the objective by 28.7%, but it is fitted to the same spectra it is scored against — a sensitivity result, not a located error.

Read the study

Deterministic color studies

Display-P3 to sRGB gamut mapping

No method wins outright. Changing only the radial coordinate space reduced the severe P3-yellow error from 23.928 to 5.523, while grid mean rose from 2.857 to 2.947. Changing the OkLCh algorithm to Local MINDE then reduced grid mean to 2.323 and the maximum to 7.602, while widening the 90th-percentile IPT hue shift from 3.368° to 4.806°.

Read the study

Color-model equation audit

An isolated background term reaches 2.595×, while the complete coupled expression spans 2.120–2.687× — crossing that value from both sides. The isolated factor is therefore neither a lower nor an upper bound on the complete expression under this declared equation sweep.

Read the study

Browser calculator and source code

One XYZ sample, two appearance models

Enter a stimulus and its viewing conditions to compare standard CAM16 with the Hellwig–Fairchild 2022 proposal. Both report J Q C M s h; the proposal keeps J and h and redefines the other four correlates.

The published fits improve for brightness and chroma but become worse for colorfulness, so the change is a tradeoff rather than a universal win.

Open the calculatorPython and JavaScript sourceEquation study

Every push runs the suite on Windows, macOS, and Linux and checks both forward models against an independent implementation.

One declared condition

Same XYZ and viewing conditions, two formulations

XYZ = 45, 36, 12
white = 95.05, 100, 108.88 (D65)
L_A = 318.31 cd/m²; Y_b = 20; average surround

CorrelateCAM162022 proposal
Lightness J59.130559.1305
Brightness Q232.56179.1392
Chroma C49.866434.4892
Colorfulness M51.835345.5003
Saturation s47.211157.494
Hue angle h45.6445.64

Shaded rows are the four correlates the proposal redefines. The columns use different scales; a smaller number is not automatically a dimmer or duller prediction.

These are model calculations, not measurements or observer validation. Neither model outputs display RGB.

Generated with public tool version 1.2.1

How it is computed

Excerpts are lifted from the tested source at build time and linked to their exact line range. None of it is retyped.

Differentiating the oversampled edge into a line-spread function, then transforming it. This runs on sensor-linear green from the black-subtracted mosaic; a demosaic or gamma step here would be measured as part of the lens.

Produces the result in SFR across aperture and field

  std::vector<double> lsf;
  lsf.reserve(esf.size() - 1);
  for (std::size_t i = 0; i + 1 < esf.size(); ++i) {
    lsf.push_back(esf[i + 1] - esf[i]);
  }
  for (std::size_t i = 0; i < lsf.size(); ++i) {
    const double w =
        0.54 - 0.46 * std::cos(2.0 * std::numbers::pi * static_cast<double>(i) /
                               static_cast<double>(lsf.size() - 1));
    lsf[i] *= w;
  }
  const auto mag = dft_magnitude(lsf);
  if (mag.empty() || mag[0] <= kEps) {
    return reject_result(std::move(result), "dc_normalization_zero");
  }

  result.mtf_frequency_cy_per_px.reserve(mag.size());
  result.mtf.reserve(mag.size());
  for (std::size_t k = 0; k < mag.size(); ++k) {
    const double f =
        (static_cast<double>(k) / static_cast<double>(lsf.size())) /
        options.bin_spacing_px;
    double mtf = mag[k] / mag[0];
    const double response =
        adjacent_difference_response(f, options.bin_spacing_px);
    if (response > kEps) mtf /= response;
    result.mtf_frequency_cy_per_px.push_back(f);
    result.mtf.push_back(mtf);
  }

code/src/sfr.cpp · lines 510–538 · extracted from the tested source at build time

Every study's implementation

Each study carries the tested excerpt that produced its result, beside the result itself.

Selected figures

Per-patch color-difference chart comparing training and held-out error for the fitted matrix, beside a patch-selection comparison.
Training against held-out error for the fitted matrix, and the patch-selection comparison that explains the better-looking headline. ColorChecker extraction and CCM validation
Bar chart of level variation per measurement group beside a scatter of level against chromaticity separation.
Level, spectral shape, and chromaticity variation across 37 repeated groups, kept on separate axes because their maxima fall on different groups. Recovering spectroradiometer measurements

Explore further

Reports hold the complete numeric record. Methods give the formulas and the implementation. The repository holds the C++20 sources, the published data, and the tests.