Imaging and color measurement · Reports
Spectral sensitivity and camera color fidelity
Question and result
The shape of a camera’s red, green, and blue spectral sensitivities limits what any later linear color transform can recover. This report checks five retained sensitivity sets in two mathematical color-fidelity analyses and, where the archive contains the necessary paired measurements, a physical chart-closure experiment.
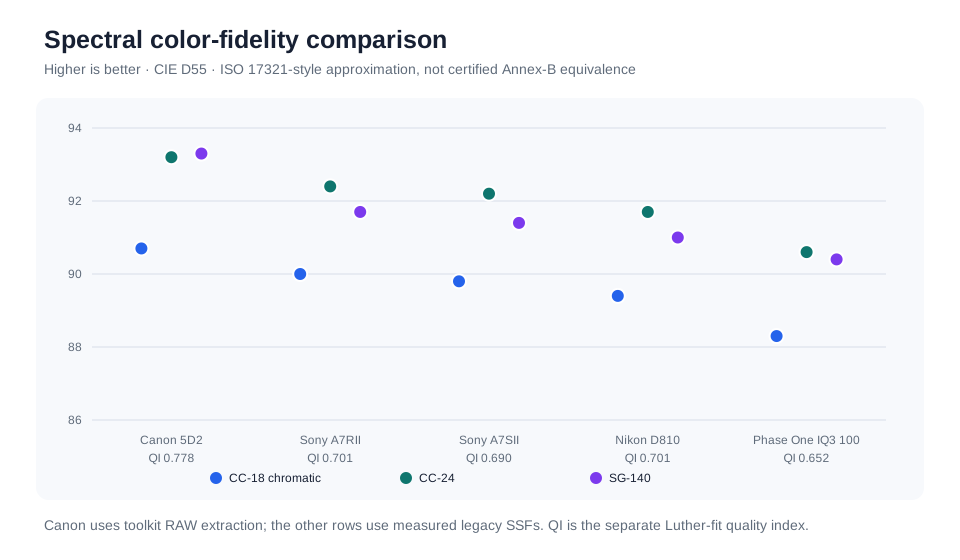
On the 18 chromatic ColorChecker patches under the declared D55 calculation, the ISO 17321-style SMI ranges from 88.3 to 90.7. Mean CIEDE2000 spans 0.88 to 1.10, but it is a separate metric and not a conversion of SMI. Four camera paths also have a paired 140-patch closure result: their per-channel relative RMS spans 9.539% to 13.802%, with minimum channel correlation above 0.992. The fifth sensitivity set lacks the paired capture required for closure.
Study · Method and formulas · Published aggregate · Validation controls · Figure
The ideal experiment and the surviving records
An ideal comparison would measure all cameras on one wavelength-verified monochromator, with repeated dark, source, and camera readings; record bandwidth, geometry, exposure, channel headroom, and environmental conditions; and pair every sensitivity sweep with the same measured illuminant, physical chart, and broadband capture. Repeats would provide an uncertainty estimate for the sensitivity curves and the resulting rankings.
The archive does not contain that complete five-camera design. It contains one shared run for four cameras and a separate Phase One IQ3 sensitivity session. The available material differs by session:
| Available material | Four-camera shared run | Phase One IQ3 session |
|---|---|---|
| Spectral sensitivities | retained | retained |
| Declared chart sets for SMI | available | available |
| CIE observer comparison | possible | possible |
| Paired measured illuminant and chart reflectance | retained | not retained as a closure set |
| Paired broadband chart capture | retained | not retained |
| Physical closure | reported | not computed |
| Monochromator make, bandwidth, and wavelength-accuracy record | incomplete | incomplete |
The absent Phase One closure values are represented by empty CSV cells, not zeros. This prevents a missing experiment from becoming a favorable result.
Analysis design
Physical closure
For patch p and channel c, the predicted response is the equal-step spectral
sum
P[p,c] = Σλ S[c,λ] E[λ] R[p,λ]
where S is camera sensitivity, E the measured illuminant, and R patch
reflectance. All inputs use one aligned, uniformly spaced wavelength grid. Its
constant sample width is absorbed by the exposure scale and therefore does not
change the fitted residual.
Before fitting the chart, measured white-card R/G and B/G ratios are checked
against the sensitivity-times-illuminant prediction. If the ratio error exceeds
the declared gate, closure stops.
When the gate passes, one scale is fitted across every patch and channel:
k = Σp,c measured[p,c] × predicted[p,c]
    -----------------------------------
          Σp,c predicted[p,c]²
Each channel then reports relative RMS and correlation. Per-channel fitted scales are retained only as diagnostics. They are not used to improve the closure result because that would absorb channel imbalance.
Luther-condition quality
The three sensitivity curves form a candidate basis for the three CIE color-matching functions. After normalizing each curve, the method fits each observer function from that basis and measures its relative residual. The three residuals are combined by RMS, and the reported quality index is
QI = 1 − combined normalized residual
A value of 1 would mean the sampled observer functions lie exactly in the camera-sensitivity subspace. The normalization makes this subspace metric invariant to nonzero channel scaling. It does not make physical response, noise, measurement quality, or cross-rig systematics invariant.
ISO 17321-style SMI
For each declared reflectance set, the method synthesizes camera RGB and reference XYZ under D55 using trapezoidal wavelength weights. It fits a 3×3 RGB-to-XYZ matrix, evaluates the residual chart errors, and reports
SMI = 100 − 5.5 × mean ΔE76
The calculation also reports CIEDE2000 and a white-preserving matrix variant. Those are diagnostics, not alternate units for SMI. The implementation follows the ISO-style sequence but is not presented as bit-exact equivalence to an unspecified Annex-B optimizer and normalization.
Results
| Camera | Sensitivity source | SMI CC18 | SMI CC24 | SMI SG140 | Mean CIEDE2000 CC18 | Luther QI |
|---|---|---|---|---|---|---|
| Canon 5D2 | toolkit RAW extraction | 90.7 | 93.2 | 93.3 | 0.93 | 0.778 |
| Sony A7RII | legacy measured SSF | 90.0 | 92.4 | 91.7 | 0.97 | 0.701 |
| Sony A7SII | legacy measured SSF | 89.8 | 92.2 | 91.4 | 0.88 | 0.690 |
| Nikon D810 | legacy measured SSF | 89.4 | 91.7 | 91.0 | 1.07 | 0.701 |
| Phase One IQ3 100 | legacy measured SSF | 88.3 | 90.6 | 90.4 | 1.10 | 0.652 |
An SMI value must name its chart set. For example, Canon is 90.7 on CC18, 93.2 on CC24, and 93.3 on SG140. Reporting only “SMI 90.7” would omit a condition that materially changes the value.
The middle ordering depends on the question. A7SII has the lowest mean CIEDE2000, while A7RII has higher SMI and ties D810 at 0.701 Luther quality. The disagreement is expected: SMI summarizes a fitted chart response, Luther quality compares subspaces without a chart, and CIEDE2000 weights residual color differences differently from ΔE76.
The comparison is mixed-source, and that was tested
The sensitivity-source column is not decoration. Canon’s curves were extracted from the monochromator RAW captures by this project’s own pipeline; the other four rows are sensitivity functions measured at the time and retained as processed curves. Canon is also the top-ranked row. A processing-path difference that coincides with the winning row is exactly the kind of artifact a ranking should be checked against, so it was:
- Toolkit RAW extractions were also run for the Nikon D810, Sony A7RII, and Sony A7SII. They produced closely matching residuals and preserved the Canon and A7SII endpoints; the D810/A7RII middle pair is resolved separately below.
- The retained Canon end-to-end comparison also resolves the agreement by channel. Toolkit-versus-legacy normalized response correlation was 0.99937 / 0.99977 / 0.99990 for R/G/B, over the wavelengths retained after excluding any with a below-dark CFA position (48 / 38 / 44 of 48).
| Camera | Toolkit-extracted curve | Legacy curve |
|---|---|---|
| Canon 5D2 | 0.2218 | 0.2221 |
| Nikon D810 | 0.2972 | 0.2989 |
| Sony A7RII | 0.2970 | 0.2991 |
| Sony A7SII | 0.3087 | 0.3102 |
The entries are normalized Luther combined residuals; lower is better. Both curve sets place the Canon first and the A7SII last. The D810 and A7RII are separated by 0.0002 within each set and exchange places between them; the published quality index rounds both to 0.701, so the aggregate reports that pair as tied rather than ordered. The control resolves the endpoints of this comparison, not its middle.
The primary aggregate keeps one curve set per camera. The separate control aggregate carries the checks above and the two retained Phase One runs. The primary table is therefore still mixed-source, and the closure table below inherits the same property. The controls reduce the curve-selection concern rather than removing it: agreement with the retained curves shows this pipeline reproduces that measurement, not that either measurement is correct.
Physical closure
| Camera | Patches | R RMS | G RMS | B RMS | Minimum channel correlation |
|---|---|---|---|---|---|
| Canon 5D2 | 140 | 9.539% | 9.840% | 11.618% | 0.994328 |
| Sony A7RII | 140 | 10.803% | 11.149% | 13.349% | 0.992517 |
| Sony A7SII | 140 | 9.901% | 9.917% | 11.252% | 0.993567 |
| Nikon D810 | 140 | 10.802% | 11.069% | 13.802% | 0.992676 |
| Phase One IQ3 100 | — | — | — | — | — |
All four paired paths preserve patch ordering strongly, but a high correlation does not mean small error. Correlation ignores absolute scale and is helped by the chart’s wide dynamic range. The channel RMS values are the direct measure of remaining proportional disagreement after the one permitted exposure fit.
Interpretation
The Canon sensitivity set has the highest CC18 SMI and Luther quality within the shared four-camera comparison. The Phase One row is lower under those same calculations, but its separate rig prevents treating the endpoint gap as a controlled camera-only effect. Apparatus, source, wavelength registration, geometry, and processing remain possible contributors.
A second Phase One sweep was retained, and it does not change the endpoint: it differs from the reported run by roughly 0.1 SMI, and its Luther combined residual is 0.336 against the reported 0.348 — last place under either run, both above the A7SII’s 0.310. That is an observed two-run difference on one rig. It bounds nothing about the offset between rigs, which is the quantity the cross-rig caveat is about.
The physical closure result is neither a ranking uncertainty nor an independent validation of the Phase One endpoint. It checks the full supplied sensitivity–illuminant–reflectance–capture chain for the four paired paths. A residual can arise from any member of that chain, and this archive does not provide a complete uncertainty budget that separates them.
The reported CIEDE2000 values do not establish universal visibility. Perception depends on stimulus, adaptation, viewing conditions, observer task, and the distribution of errors, none of which was tested here.
Addendum — what the Phase One records can and cannot establish
The Phase One IQ3 session is the one case in this archive where the retained records support part of the analysis and not the rest. Recording where that line falls is more useful than either dropping the camera from the comparison or extending its row past what was measured.
| Question | Available data | What follows |
|---|---|---|
| How closely do the sensitivities span the CIE observer functions? | Two retained camSPECS sensitivity sweeps | Luther residual is computable |
| What modeled test-set residual remains under the declared D55 calculation? | Sensitivities plus the common D55 and reflectance test sets declared by the calculation | ISO 17321-style SMI is computable |
| Does the reported endpoint change between the two retained sweeps? | Two retained runs | Not in this table: SMI 88.3 / 88.4, Luther residual 0.348 / 0.336; this is an observed two-run check, not a general guarantee |
| Do the sensitivities predict a real chart capture? | No paired broadband chart capture, chart reflectance, or chart-capture illuminant record | Physical closure cannot be computed |
| Is this a controlled comparison against the other four cameras? | Separate rig and session, no overlapping camera | No camera-only ranking is available |
| Do two sweeps establish repeatability? | Two retained runs, not a designed repeat study | Observed spread only, not an uncertainty estimate |
Why closure specifically is blocked
Closure predicts a chart response from the sensitivities and compares it with a measurement of that same chart. It therefore needs a defensibly paired set of sensitivity curves, chart-capture illuminant spectrum, measured chart reflectance, and broadband chart capture. The Phase One session retains the sensitivity sweeps and a camSPECS lamp record, but not the illuminant, reflectance, and capture set required for broadband chart closure. The declared D55 and reflectance sets used by the SMI calculation are modeling inputs, not missing Phase One chart measurements. Without a measured chart response there is no quantity against which to test the prediction, so closure has no defined result rather than a poor one. That is why those cells are empty and not zero: a zero would report perfect closure for an experiment that was never performed.
What this row does not say
Under the declared calculations this camera has the highest Luther residual and the lowest SMI in the table. That is a statement about numbers produced from a different apparatus in a different year, not a statement about the sensor. The apparatus, wavelength registration, source, geometry, and curve-processing path all differ from the shared run, and nothing in the archive separates their contributions from the camera’s. Reading the position as camera performance would require a controlled comparison that these records cannot supply.
What the records cannot attribute
The retained sweeps support the sensitivity-only calculations, but they cannot determine whether this row’s position originates in the camera’s spectral sensitivities or in the separate acquisition path around them. The source, wavelength registration, geometry, dark treatment, and curve processing all differ from the shared run, and each can affect the result. They are confounded here: nothing in the retained records varies one while holding the others fixed, so no share of the difference can be assigned to the sensor.
That is an attribution limit, not a shortcoming of the retained work. The sweeps are complete for what they measure, and the sensitivity-only results built on them stand. What is absent is a matched acquisition that would reduce the major rig and session confounds and permit a common-condition comparison — specified under remaining question below. Isolating the sensor from the lens and the rest of the optical and capture path would require additional controls. Until those measurements exist, this row is a useful cross-rig observation rather than a controlled statement about the camera.
Published method and remaining measurement gap
The published C++ layer implements the three numerical analyses on aligned in-memory inputs. Synthetic unit tests cover exact closure, a failed white-card gate, channel imbalance, the normalized Luther residual and scale invariance, SMI’s defining slope, a metameric counterexample, white preservation, and declared invalid-input cases.
Those tests do not read the private monochromator captures or recreate archive selection. The retained original measurements were used for the reported results and remain private. This portfolio publishes the numerical methods, synthetic tests, aggregate results, and study-specific checks needed to explain the analysis.
The actual missing inputs are narrower. The separate Phase One session has no paired broadband chart capture or measured chart reflectance, so physical closure cannot be computed for that camera. Across both sessions, incomplete rig-characterization and repeat records also prevent an absolute-accuracy or full uncertainty estimate. Neither limitation invalidates the calculations that the retained inputs do support.
Remaining question
A matched overlap acquisition is the missing experiment: measure the IQ3 and at least one camera from the shared run on one documented apparatus, then repeat the sweeps and acquire a broadband chart capture with a measured illuminant and chart reflectance. That would test whether the endpoint persists under common conditions, admit the Phase One path to physical closure, and—with a designed repeat set—support a within-session uncertainty estimate. It would not isolate the sensor without further optical-path controls. Additional analysis of the existing files cannot replace that physical link.
Source file: reports/spectral-sensitivity.md