Color Atlas: Exploring Color Appearance
How do hue, lightness and chroma fit together, and how do the assumed viewing conditions change the colors a model calculates? Color Atlas is an interactive MATLAB app that makes these relationships visible as grids of color. Select a slice, move through it, and inspect the calculated values of any tile.
Get the MATLAB app and source code
Color Atlas began as a graduate coursework project in 2024 with my classmates Nima Rabbanifar and Soroush Shahbaznejad. For version 2, I fixed a few issues and made improvements to the app, building on the scientific models and shared MCSL implementations.
Reading a slice of color
A color atlas arranges colors by their attributes. This view holds hue, the color family, fixed at 180°. Moving right increases chroma, the strength of color relative to white. Moving upward increases lightness, relative to the model’s adopted white. Changing the hue reveals another slice while the axes retain the same meaning.
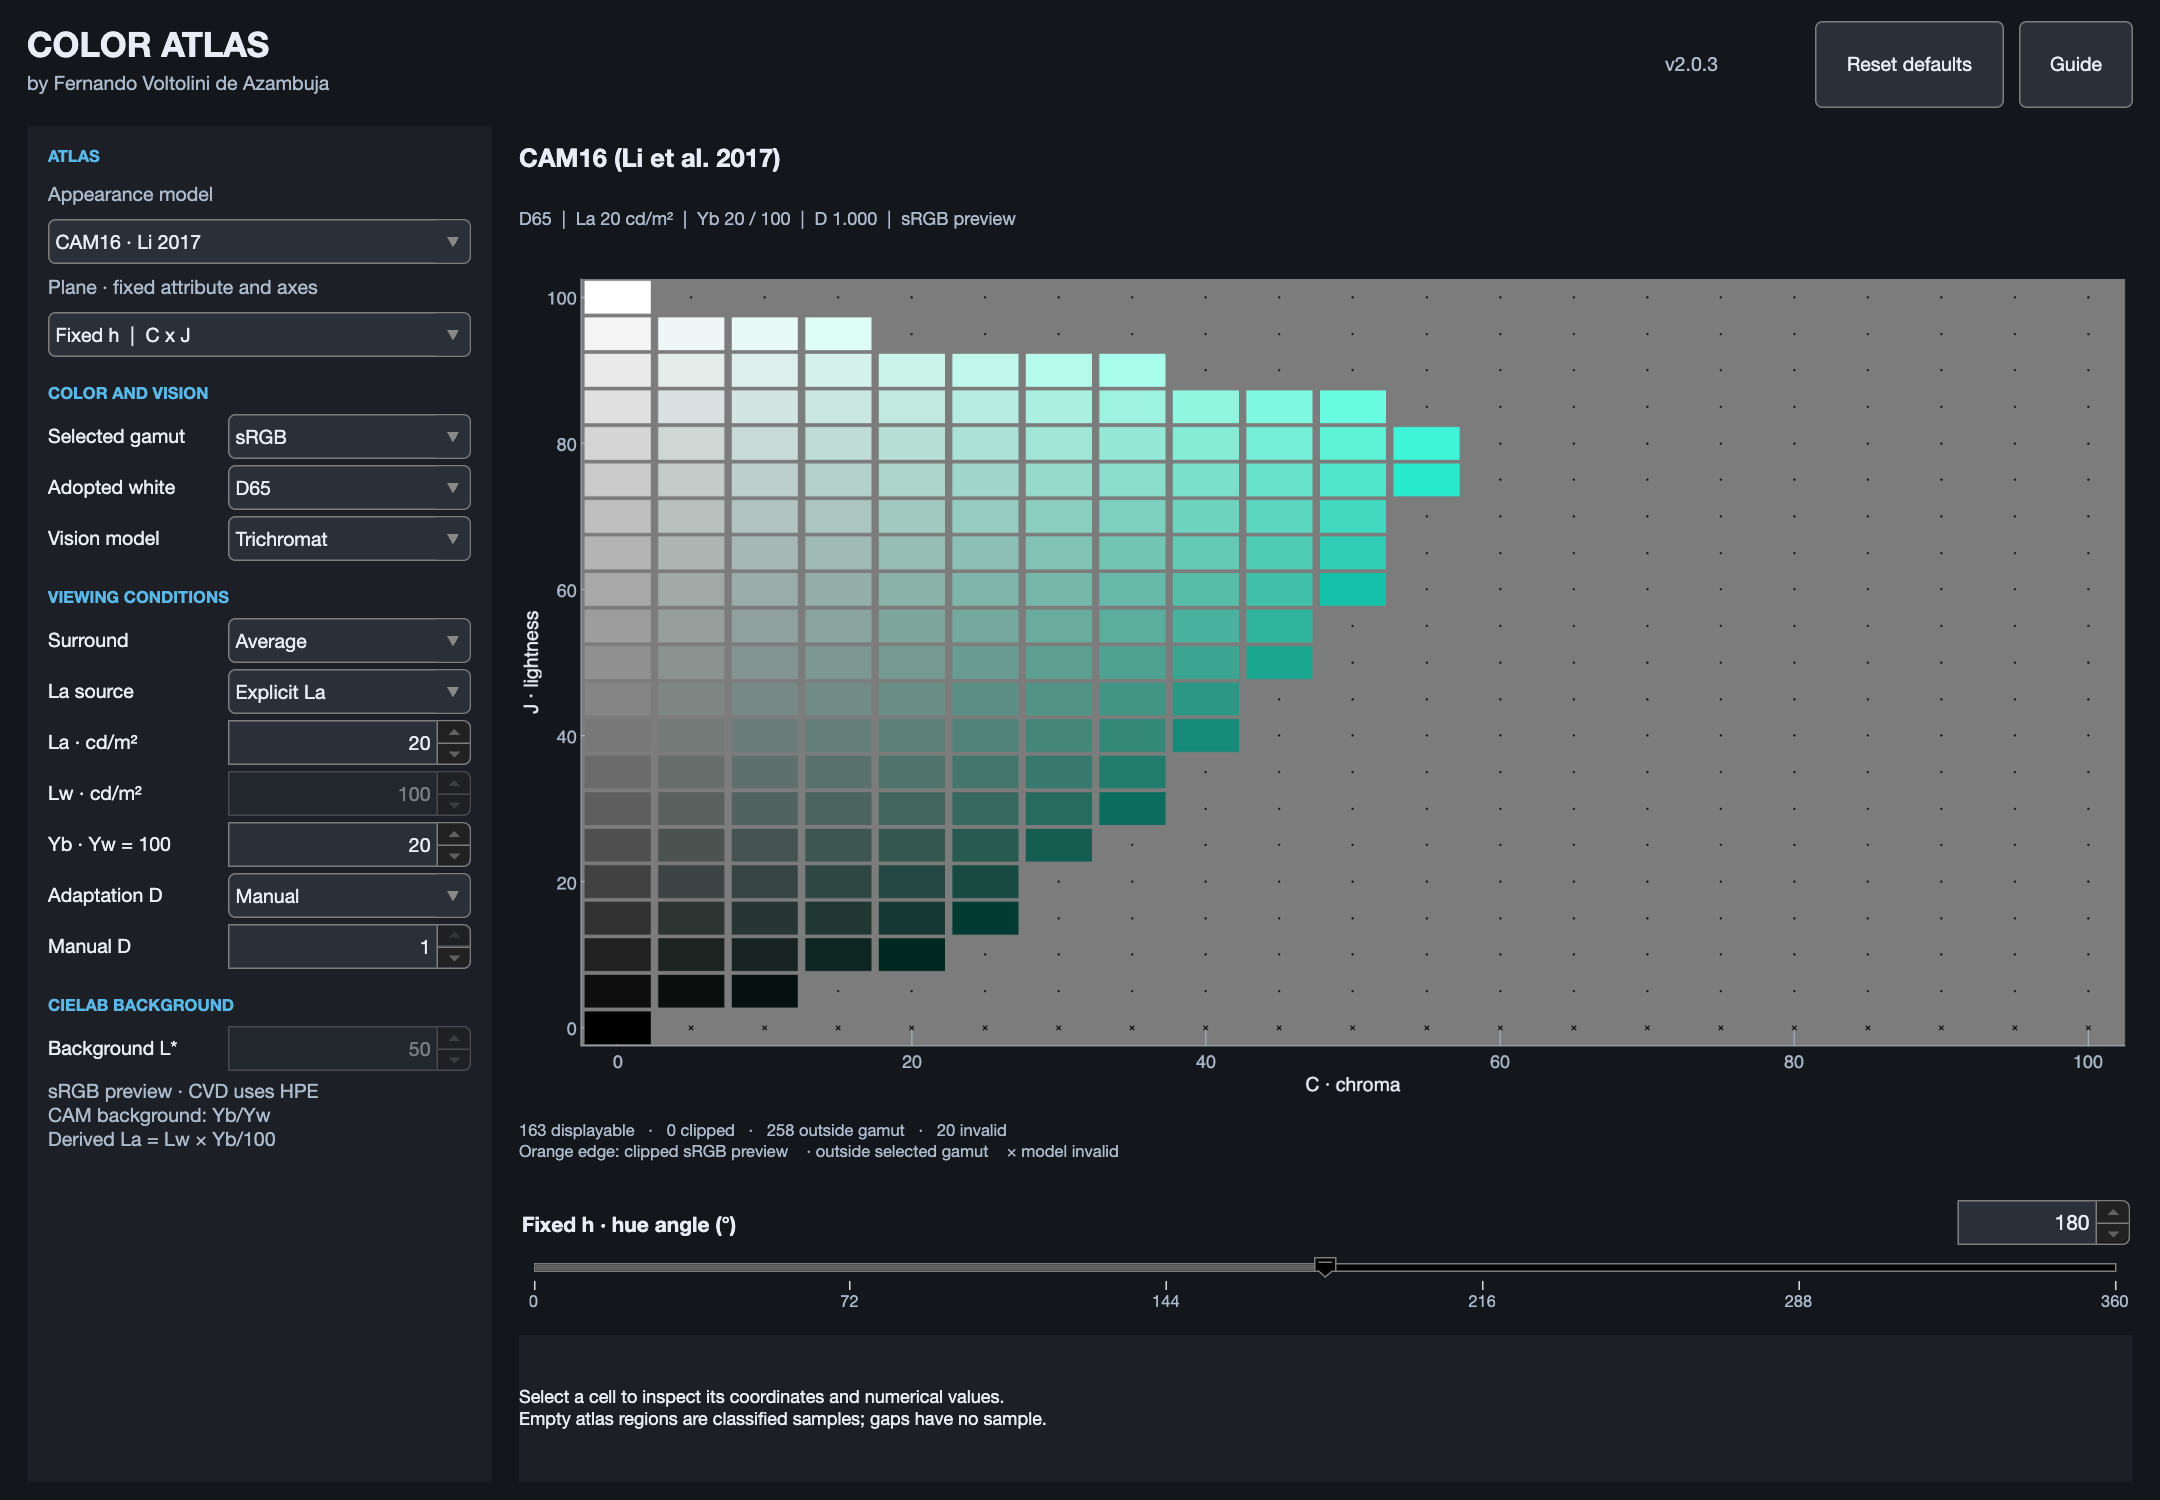
Clicking a tile connects the picture to its coordinates, XYZ tristimulus values and RGB values. The numeric field selects an exact slice; the slider lets a student or presenter browse neighboring slices. This makes model relationships easier to investigate than a list of equations alone.
Viewing conditions are part of the calculation
A color-appearance model predicts attributes such as lightness and chroma from a color stimulus and its viewing environment. The atlas runs that calculation in reverse: it starts with the requested attributes and calculates the XYZ values needed to produce them under the chosen conditions.
Changing the adopted white, background, surround or adapting luminance recalculates the plane. In the view above, the hue, chroma and lightness coordinates remain fixed while the required XYZ values change. The controls stay beside the plot so the assumptions remain visible during exploration.
CIELAB provides a familiar reference-white-based view. CIECAM02, CAM16 and the Hellwig formulations add appearance-model relationships. The models use different definitions and scales, so their numerical values need to be read within each formulation.
A model color and its screen preview
The gamut of an RGB space is the range of colors it can represent. A plane can include coordinates that fit a wide space such as ProPhoto RGB but do not fit the sRGB space used for the screen preview. The atlas keeps those two questions visible: does the color fit the selected gamut, and can this preview show it?
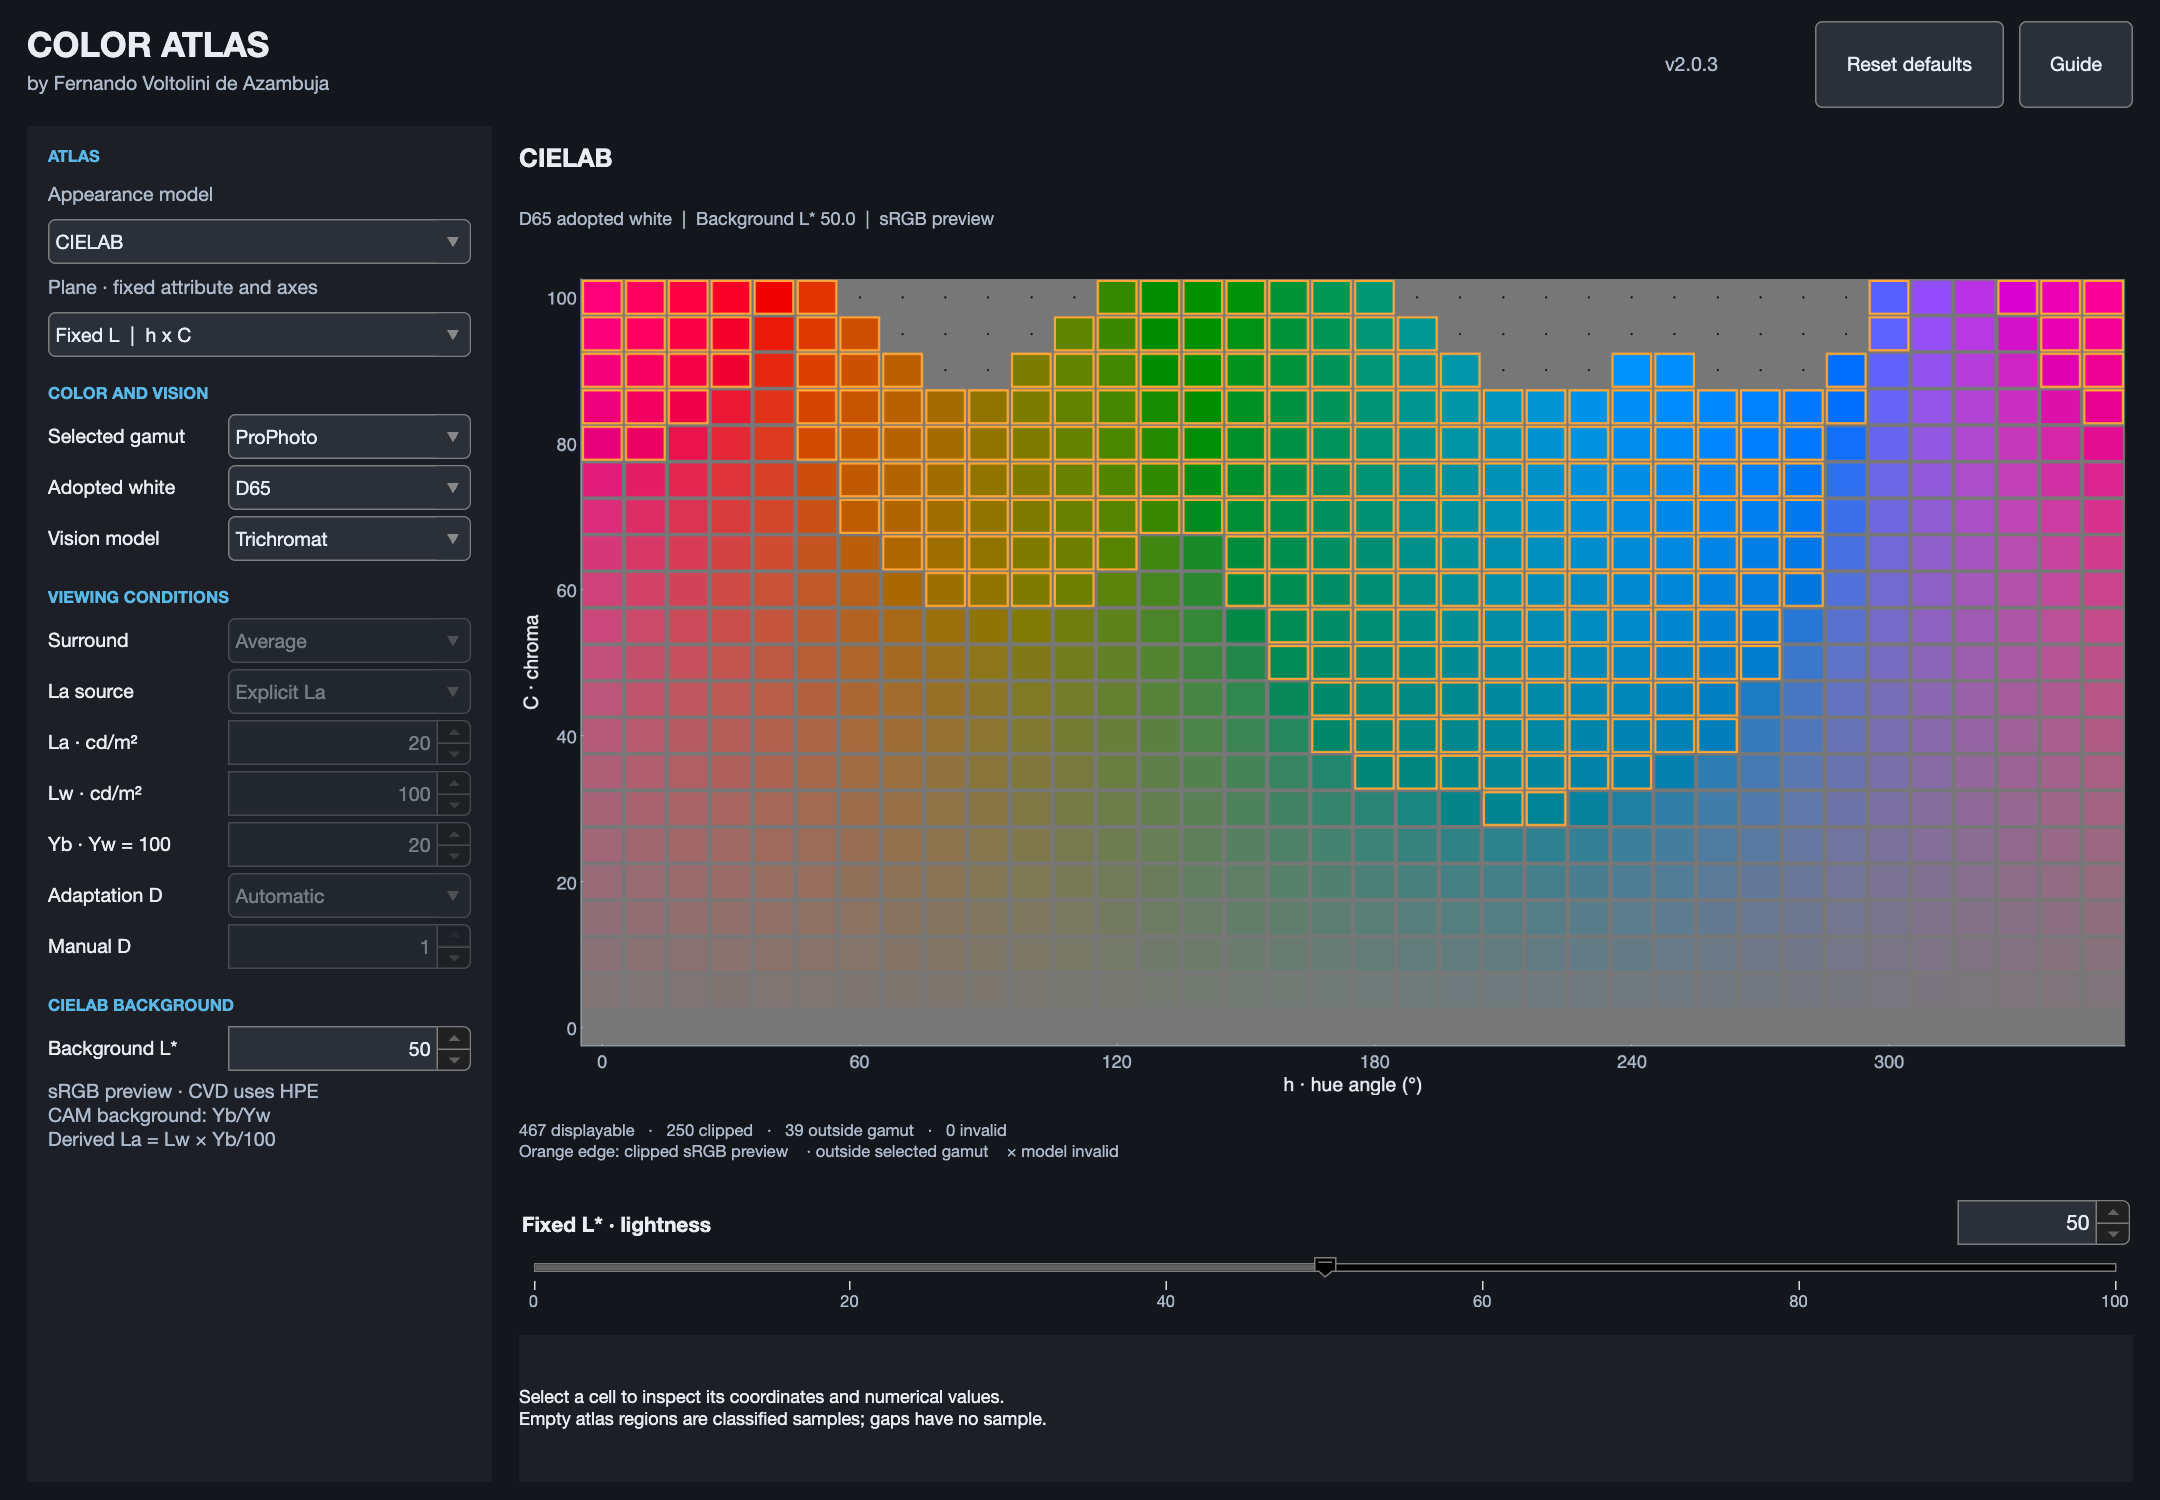
Dots mark samples outside the selected gamut; crosses mark coordinates with no valid model result. These markings let the viewer distinguish the shape of the selected gamut from the limits of the calculation and the preview.
Implementation and numerical checks
I developed a responsive MATLAB interface and a separate numerical API for computing the planes. The app supports tile inspection, scripted settings and repeatable captures. Its calculations are checked against independent numerical references and published worked examples, with additional tests for viewing conditions, gamut classification and interface behavior.
The app explores calculated color. It does not measure or calibrate monitor output, and its optional color-vision-deficiency views are model approximations. The source code includes the scientific references, setup instructions and numerical tests.
The CAM16 and Hellwig–Fairchild calculator provides a complementary view: enter one XYZ stimulus to compare the models’ appearance predictions. Color Atlas explores the inverse calculation across an entire plane.