Imaging and color measurement · Studies
What can repeated spectroradiometer readings still tell us?
A spectroradiometer measures how much light arrives at each wavelength. That spectrum sits underneath every downstream color number — a white point, a chromaticity, a correlated color temperature — so an archive of readings is only worth as much as the certainty about which reading is which.
This archive arrived as files whose names counted acquisitions rather than describing what was measured, with several readings stored more than once under different names. Before any variation could be interpreted, each reading had to be identified by its contents, and readings of the same target had to be grouped correctly.
Then the interesting question: when the same target is measured twice, what actually differs — the amount of light, the shape of the spectrum, or the color?
Content comparison separated 89 distinct readings from 45 byte-identical aliases; the retained grouping record then organized the distinct readings into 40 groups. Median level variation across the repeated groups was 7.17% and the maximum level variation reached 41.65% — but the group with the largest level swing was not the group with the largest shape or chromaticity change, so the three cannot be collapsed into one stability score.
Identity and grouping are two different operations
Content identity separated 89 distinct readings from 45 byte-identical aliases. Comparing bytes establishes that two files hold the same measurement; it cannot establish that two different measurements were taken of the same target.
Grouping is the second operation, and it comes from the retained grouping record — not from spectral similarity. Inferring target identity from how alike two spectra look would assume the answer: two readings of one stable source and two readings of two similar sources are indistinguishable that way. The record assigns 40 groups, of which 37 hold repeated readings and 3 are singletons.
Three axes, kept apart
Each repeated group is characterized three ways, because the measured values can change on one axis while remaining comparatively stable on the others:
- Level — the coefficient of variation of the equal-weight spectral integral: how much total radiance differed between repeats.
- Shape — the relative L2 residual between spectra after each is normalized by its own integral, which removes level entirely.
- Chromaticity — the largest pairwise Δu′v′ within the group, computed from the recorded XYZ.
They are not independent — chromaticity is a functional of the normalized shape through the CIE observer — but they isolate different failure modes.
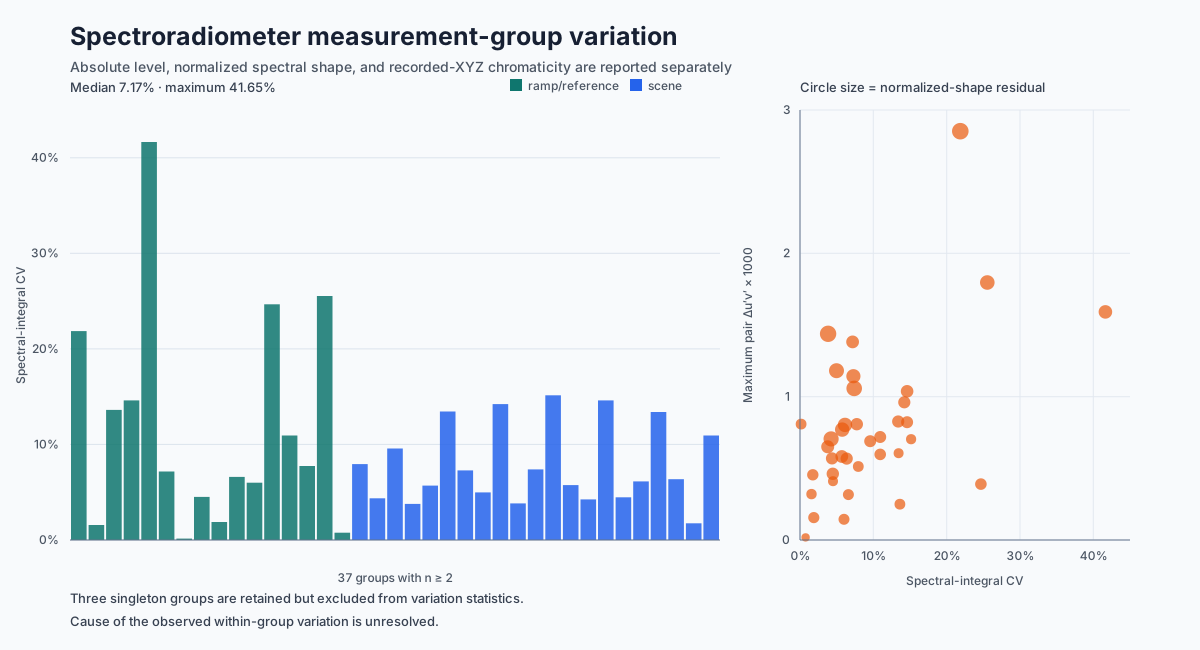
Both panels cover the same 37 groups. Left: level variation, one bar per group, sorted. Right: the same groups as circles, with horizontal position the level variation, vertical position the largest chromaticity separation in the group — note that axis is scaled ×1000 — and circle size the normalized shape residual, readable as ordering rather than as values.
The result
Across the 37 repeated groups, from
spectroradiometer-group-summary.csv:
| Axis | Median | Maximum |
|---|---|---|
| Level, coefficient of variation | 7.168% | 41.647% |
| Shape, relative L2 residual | 0.518% | 1.076% |
| Chromaticity, maximum pairwise Δu′v′ | 0.000703 | 0.002852 |
The maxima land on different groups. ramp_patch_05 has the largest level
variation; ramp_patch_01 has both the largest shape residual and the largest
chromaticity separation. The group with the largest observed level change is
therefore not the group with the largest shape or color change.
That is the finding. These three numbers do not describe one condition, and no single stability score summarizes this archive without discarding something.
Reference implementation
The relevant calculation from the public C++ implementation.
SpectroGroupAnalysis analyze_spectro_group(
    const std::vector<SpectroMeasurement>& readings) {
  std::vector<SampledSpectrum> spectra;
  spectra.reserve(readings.size());
  for (const auto& reading : readings) {
    spectra.push_back(
        SampledSpectrum{reading.wavelength_nm, reading.spectral_radiance});
  }
  const auto generic = analyze_sampled_spectrum_group(spectra);

  SpectroGroupAnalysis result;
  result.count = generic.count;
  result.wavelength_step_nm = generic.wavelength_step_nm;
  result.sample_weighting = generic.sample_weighting;
  result.mean_spectral_integral = generic.mean_spectral_integral;
  result.sample_stddev_spectral_integral =
      generic.sample_stddev_spectral_integral;
  result.coefficient_of_variation = generic.coefficient_of_variation;
  result.mean_normalized_spectrum = generic.mean_normalized_spectrum;
  result.sample_stddev_normalized_spectrum =
      generic.sample_stddev_normalized_spectrum;
  result.max_shape_relative_l2 = generic.max_shape_relative_l2;
  result.readings.reserve(readings.size());
  for (std::size_t index = 0; index < readings.size(); ++index) {
    result.readings.push_back(SpectroReadingAnalysis{
        generic.readings[index].spectral_integral,
        generic.readings[index].normalized_spectrum,
        chromaticity(readings[index].recorded_xyz)});
  }

  if (readings.size() < 2) {
    return result;
  }
  double maximum = 0.0;
  for (std::size_t first = 0; first < result.readings.size(); ++first) {
    for (std::size_t second = first + 1; second < result.readings.size();
         ++second) {
      const auto& a = result.readings[first].recorded_xyz_chromaticity;
      const auto& b = result.readings[second].recorded_xyz_chromaticity;
      maximum = std::max(
          maximum,
          std::hypot(a.u_prime - b.u_prime, a.v_prime - b.v_prime));
    }
  }
  result.max_pair_delta_u_prime_v_prime = maximum;
  return result;
}
code/src/spectro_analysis.cpp · lines 44–90
What the differences are not
They are within-group observed variation and nothing stronger.
The archive kept the spectra and the recorded numeric fields. It did not keep the physical setup, geometry, integration time, or instrument configuration — exactly the records that would let a difference between repeats be attributed to a cause. Source output, re-aiming, acquisition settings, and instrument behavior are not separable here, so calling any of this drift, noise, or repeatability would name a mechanism the record cannot support.
The three singletons carry empty variation fields rather than zeros. One measurement establishes a level and a shape; it does not establish a spread, and a zero would read as perfect agreement.
An internal consistency check
Integrating each spectrum against a public CIE observer should reproduce the XYZ the instrument recorded in the same file. It does: one archive-derived proportional scale of 683.0167582353332 fits every reading and channel, with maximum absolute relative residual 1.55e-13%.
That is numerical closure between fields in the same file. It shows the spectral and colorimetric records describe the same measurement. It is not an instrument-accuracy test, and the fitted scale is archive-derived — not a standard luminous-efficacy constant, whatever its magnitude suggests.
An independent MATLAB R2026a read of the same files reproduced all 89 readings and their retained numeric fields, with a largest absolute difference of 4.5e-12 K on recorded CCT. This cross-check shows that the two readers agree on the retained vectors and fields; it does not independently reproduce the group assignments or the group statistics.
What would resolve it
A repeat experiment should record what this one did not: fixed and documented geometry, integration time, and instrument configuration; an independent source monitor or stable reference channel; and interleaved repeats that expose warm-up and time-order effects. Those controls would make source, setup, and instrument explanations testable. Without them, 41.6% remains a quantified within-group difference with no defensible causal label.
Detail: report · method and formulas · group summary · validation summary · reference implementation
Source file: studies/spectroradiometer-recovery.md