Imaging and color measurement · Reports
Spectral measurement and reference-data cross-check
Why this comparison exists
An archived disagreement is tempting to turn into an instrument ranking. That would be the wrong experiment here. The labels identify two instrument paths, but acquisition timing, source monitoring, geometry, calibration state, wavelength accuracy, bandpass, settings, and per-unit identity were not retained well enough to isolate an instrument effect.
The records can still support a useful scientific investigation: separate level from shape, compare the shapes on one declared wavelength grid, localize the residual, and test contradictory metadata by recomputing the colorimetry. The result is a diagnostic comparison and a design for the next measurement, not proof of controls the archive never recorded.
What each retained input can answer
| Retained input | What it can establish | What it cannot establish |
|---|---|---|
| Two HID series, 8 readings each | within-series variation and localized cross-series difference | source or instrument cause |
| Four 24-patch exports | stable-identity interchange and metadata consistency | independent measurement agreement |
| Candidate chart pair | observed pairwise spectral/colorimetric difference | repeatability or accuracy |
The HID series use different native grids: one covers 380–780 nm at 4 nm and the other 380–730 nm at 10 nm. Their labels are retained identities, not a calibration result.
Separating level from shape
For reading i on a uniform native grid:
I_i = Δλ Σ_k x_i(λ_k)
s_i(λ_k) = x_i(λ_k) / I_i
I_i carries sampled level; s_i carries normalized shape. Keeping them
separate avoids calling an intensity change a spectral-shape change.
| Quantity | First retained series | Second retained series |
|---|---|---|
| Reading count | 8 | 8 |
| Level coefficient of variation | 0.591% | 0.326% |
| Maximum shape relative L2 | 0.307% | 0.207% |
Comparing unlike wavelength grids
The two mean normalized shapes are linearly resampled to the shared 380–730 nm, 10 nm grid and normalized again on that common support. The directional residual is:
E = sqrt(Σ_k (c_k - r_k)²) / sqrt(Σ_k r_k²)
The denominator is the declared reference norm; reversing the series changes the meaning. Each band’s contribution is its squared residual divided by total squared residual.
The full 36-band comparison is 4.327%. The 530 nm band contributes 25.8% and 540 nm contributes 50.1%, for 75.9% combined. Omitting both diagnostic bands leaves 2.276%. Exclusion is reported separately and does not alter the primary normalization.
The relative-axis sweep shifts the reference series from −2 to +2 nm in 0.05 nm steps and evaluates every offset on the common 35-band interior. The zero-offset objective is 4.327416%; the minimum is 3.084143% at −0.95 nm. Because each offset is renormalized and can have a different reference norm, the 28.7% change is a reduction in the directional-relative-L2 objective—not a fraction of residual energy removed.
At the fitted offset, 530 and 540 nm still carry 40.1% of the squared residual. A fitted shift therefore does not make the localized discrepancy disappear.
Auditing contradictory observer metadata
One export carries two incompatible observer declarations. Rather than choose one by filename or convention, both are evaluated explicitly:
| Recalculation | Agreement with embedded values |
|---|---|
| D65 / CIE 1964 10° versus embedded Lab | 0.0119 mean, 0.0412 max ΔE76 |
| D65 / CIE 1931 2° alternative | 3.909 mean, 12.346 max ΔE76 |
| Second application’s D65/2° embedded XYZ | 0.0469% mean, 0.1104% max relative L2 |
The much smaller 10-degree Lab result resolves that export’s metadata conflict numerically. The separate 2-degree XYZ result shows why the observer must be checked per output rather than globally.
Stable sample identity also shows that all four files contain the same 24 spectra. Different layout labels and two malformed field-count declarations are serialization differences; they do not represent new measurements.
Candidate paired-chart comparison
Across 24 paired rows, mean reflectance RMS is 0.00458 and the maximum is 0.00852. Under D55 and the CIE 1931 2-degree observer, mean difference is 0.851 ΔE76 and maximum difference is 1.952. Because instrument, session, geometry, and timing are not retained, these are observed differences between the two tables, not repeatability or accuracy estimates.
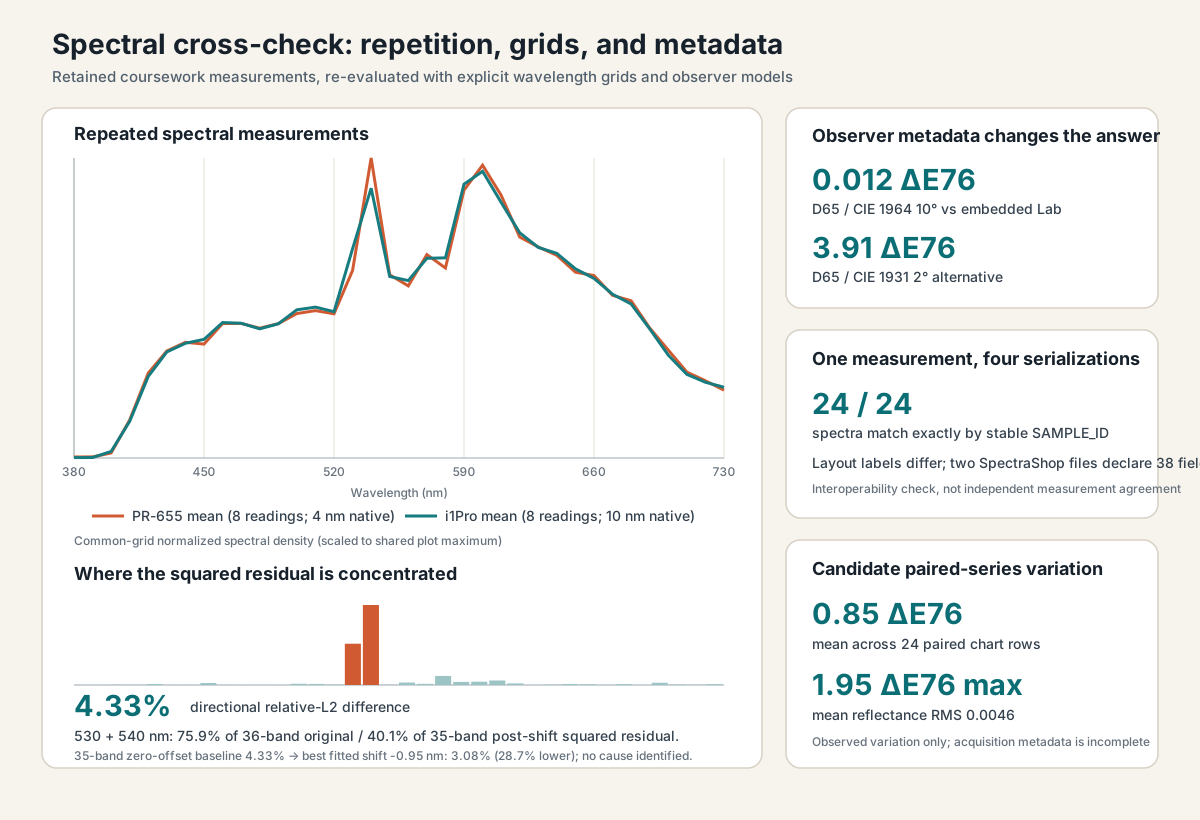
The left panel compares normalized means and assigns the original squared residual by band. The right panels show metadata interpretation, exact interchange by stable identity, and paired-chart variation. They remain separate parts of the analysis.
Published method and source scope
The public C++ module reproduces the common-grid comparison, residual localization, diagnostic exclusions, and offset sensitivity from supplied numeric spectra. Its tests use synthetic data and run without archive inputs.
The source reflectance exports and reference-table ingestion layer remain private. This portfolio publishes the comparison method and aggregate results needed to understand the finding. The scientific limitation is separate from that publication choice: even with the source files, the missing acquisition controls would still prevent causal attribution.
Resolving experiment
Interleave both instruments on a monitored source, retain calibration state, settings, geometry, timing, and per-unit identity, and include a characterized higher-resolution reference for wavelength and bandpass behavior. That design would vary instrument path while holding source and setup fixed; this archive does not.
Source file: reports/spectral-measurement-crosscheck.md